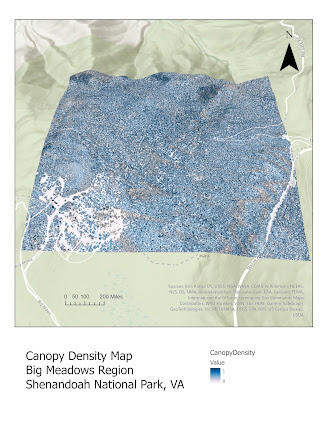
For Module 2, we learned about Light Detection and Ranging technology and its applications in GIS. Specifically, we utilized LiDAR data to
analyze the density, tree height, and elevation of a forest in the Shenandoah,
VA area.
I enjoyed working with LiDAR data this week, but experienced some challenges when it came to creating the LIDAR map. Although I could see all data points when viewing the scene in the ArcGIS scene view, I could not get the Map Layout to show all data points. Instead, the Map Layout displayed a red bounded box at the top. Typically, the solution is to zoom in a little further so that the red bounded box disappears - and then the data points appear. But, the top of the red bounded box remained, despite many attempts to fix it. (See LIDAR map below)
Otherwise, I found this week's module entertaining and informative! I especially enjoyed working with the tree height/density maps and learning about forestry in general!


No comments:
Post a Comment